
About the project
Our objective in this project was to develop a standalone Scalable Vector Graphics (SVG) map-editor able to create and edit maps for the Visavi software. The Visavi software visualizes planned maintenance jobs at large facilities, like factories, power plants and oil rigs, and the map provides situational awareness by filtering the jobs to the selected area.
The goal of the project was to uncover how such an editor could be developed. Therefore, a prototype was developed alongside a comprehensive report, detailing the development process.
The project was divided into two main phases. The first phase was research and information gathering while the second phase was designing and developing the editor.
Through the research phase we gathered information about:
- similar products
- was done to uncover possible existing solutions we could use, as well as borrowing design and features implemented in successful editors.
- SVG
- This was done to learn about how SVGs are created and how we could use the Document Object Model(DOM) to manipulate SVGs
- development methods
- Different development methods were researched to find the appropriate method for the project.
- design methods
- how to create a design which maintains usability and user experience while allowing users to complete the required task.
- Interview techniques
- For uncovering requirements and conducting user tests
After a thorough research the development phase began. We applied an incremental development method with each increment building on what was learned and uncovered in the previous iteration. Each increment had a different focus. The early increments consisted of developing a design. This was done using a mix of parallel design and competitive analysis. The next increments focused on adding more and more features. The later increments focused on improving user experience.


Pictures:
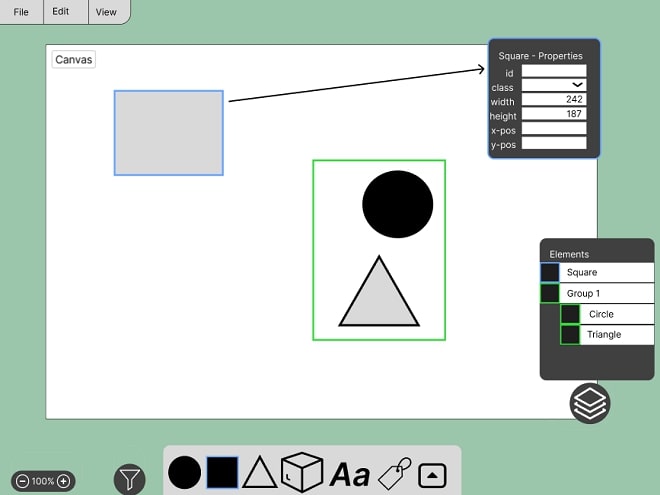
- This is a picture of our design after the first increment of our development method.
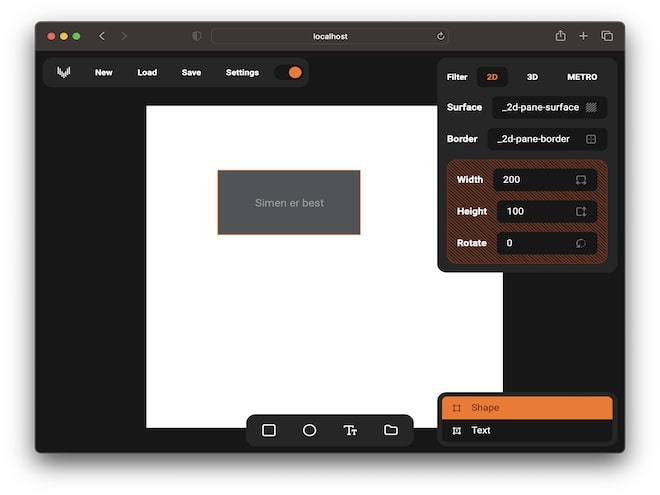
- Illustrates how the editor can be used to create custom maps for Visavi’s software.
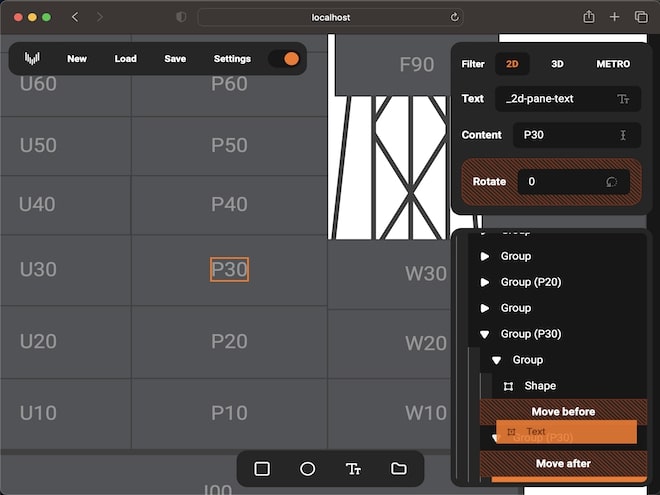
- In this version it was possible to edit, group, change position in layers-list. This picture illustrates the moving of an element in the layers-list, effectively changing the z-dimensional position of the element.
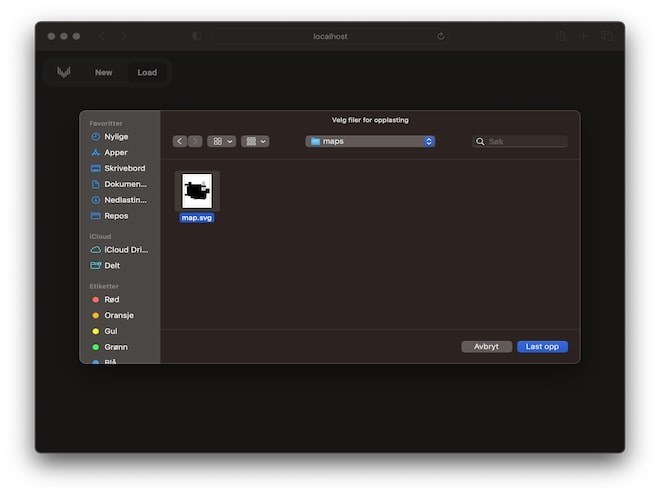
- The editor can also be used to import and edit existing maps. Both created with our editor and Visavi’s current solution.
Project members
Erik Teien Jarem
Ole Jørgen Andersen
Simen Jacobsen Øygard
About the client
Visavi Technology was founded in 2014 with a product idea based on research done at Norwegian University of Science and Technology (NTNU) Research Centre of Integrated Operations and Institute of Energy Technology (IFE). Visavi specializes in visualizing planned maintenance at larger facilities like refineries, oil platforms and factories. The Visavi software helps keep all maintenance workers and planners informed on the current situation by pro-viding the same updated information for all to see, with the goal of increasing effectiveness and safety for all operations.
Visavi is located in Sarpsborg and currently has around 18 employees. In the beginning of 2023 Visavi was acquired by Kongsberg Digital. Among the customers are Borregaard, Repsol, Repsol Sinopec and Neptune Energy.
Supervisor
Marius Geitle